Posted: April 23rd, 2008 | 1 Comment »
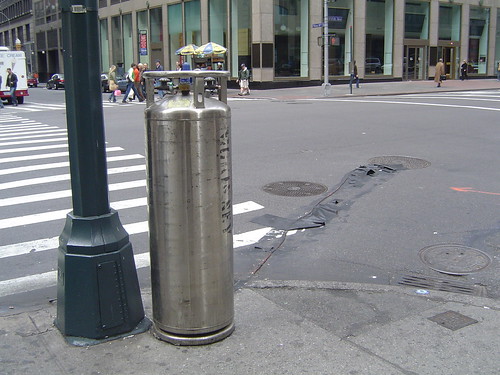
In a recent visit to New York, I ran into nitrogen tanks at several of the city corners. There are many guesses to why there are there and who put them there. The most common belief indicates that telecom companies uses them in the maintenance of cables and fiber bundles. For instance, Verizon seems to use the tanks to pump nitrogen gas into the phone lines to keep them dry. In any case, these tanks are great examples of unexpected protuberance on top of a city invisible infrastructure, very much similar to the painting at the crossroads, roads, and sidewalks revealing the underground networks. Yet another Sliding Friction moment.
Posted: April 16th, 2008 | No Comments »
Yesterday, I presented at the 2008 Association of American Geographers Annual Meeting, the preliminary results of my ethnographic study on the use, adoption, and appropriation of satellite navigation systems by taxi drivers in Barcelona (slides). The abstract of the paper “The co-evolution of taxi drivers and their in-car navigation systems” co-authored with Josep Blat goes as follows:
In recent years, the relative market success of in-car navigation systems has symbolized the emergence of location-based services for wayfinding. This market success creates the opportunity to learn from real-world use of current location-aware systems in order to inform the design of future applications. With this aim, we are using an ethnographic approach to study the different ways taxi drivers rely on their navigation system. This work describes how location technologies impact the wayfinding practices and also how practices influence the appropriation of navigation systems. This co-evolution goes from the acquisition and setup of a navigation system to mastering the system shortcomings and limitations. Next, we study the reasons upon which a driver selects among the different modes of a navigation system and the other artifacts and tools (e.g. maps, street directories, landmarks) he or she uses for location awareness and wayfinding. Moreover, we analyze the role of context in this dynamics, i.e., where and when a driver accesses location information from the system, the external supports and the surrounding environment. We present the findings that emerged from 12 interviews augmented by in-car observations within the community of taxi drivers of the city of Barcelona, Spain. This community forms a massive population of early adopters of in-car navigation systems with a strong past practice of relying on mobile technologies and maps to support their work.

Posted: April 16th, 2008 | 1 Comment »
My paper “Leveraging Explicitly Disclosed Location Information to Understand Tourist Dynamics: A Case Study”, co-authored with Josep Blat, Filippo Dal Fiore and Carlo Ratti, has been accepted for publication in the Journal of Location Based Services. The abstract goes as follows:
In recent years, the large deployment of mobile devices has led to a massive increase in the volume of records of where people have been and when they were there. The analysis of these spatio-temporal data can supply high-level human behavior information valuable to urban planners, local authorities, and designer of location-based services. In this paper, we describe our approach to collect and analyze the history of physical presence of tourists from the digital footprints they publicly disclose on the web. Our work takes place in the Province of Florence in Italy, where the insights on the visitors’ flows and on the nationalities of the tourists who do not sleep in town has been limited to information from survey-based hotel and museums frequentation. In fact, most local authorities in the world must face this dearth of data on tourist dynamics. In this case study, we used a corpus of geographically referenced photos taken in the province by 4280 photographers over a period of 2 years. Based on the disclosure of the location of the photos, we design geovisualizations to reveal the tourist concentration and spatio-temporal flows. Our initial results provide insights on the density of tourists, the points of interests they visit as well as the most common trajectories they follow.
The reviews validate the direction of my theis. They ask me to explore how the insights insight gained from this project can be transferred to other user groups and compare the outcome with the available tourist services. They propose to continue exploring the issues around the quality of the data (i.e. how to reduce the uncerntainty in a bit detailed manner). Finally, I make a case that the visualization validate my hypothesis, but I could also point out the anomalies or unexpected behavior patterns (journalists somehow requested similar outcomes). And, yeah, not to forget the encouraging comment… “This is an excellent paper, covering a very timely and interesting topic“.
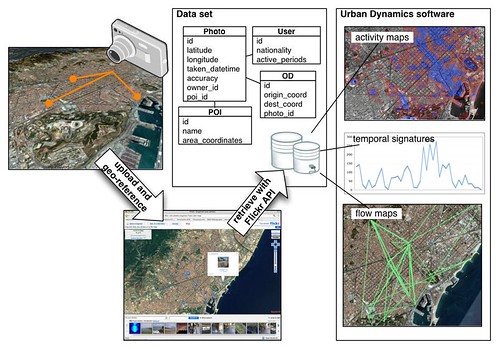
Data flow, from data recording, retrieving, storing to the visualizations.
Posted: April 12th, 2008 | No Comments »
Next week, I will attend the 2008 Association of American Geographers Annual Meeting in Boston where I will present my work The co-evolution of taxi drivers and their in-car navigation systems at the session Situating Sat Nav 2 (from 4:20 PM – 6:00 PM). Description of the session:
Sat Nav offers technologically sophisticated spatial data models of the world, but the technology quickly sinks into taken-for-granted everyday driving practices, such that its social and political significance is hard to assess. The gadgets themselves take space on the dashboard and windscreens, but also make new senses of space for the driver, well beyond the car. The session will present a range of theoretically informed analyses questioning the social effects, cultural meanings and political economy of in-car satellite navigation.
Other sessions I plan (or wish) to attend are:
Tuesday
“New” Geographies of Mobility and Accessibility: Theory, Modelling, and Policy Implications (from 12:00 PM – 1:40 PM)
During the 1950s, Ullman and Mayer prepared an initial sketch of the areas of knowledge specialization emerging from the intersection of geography and transportation. Their work provided a framework for the development of Transportation Geography. Among the various themes they identified, there was an emphasis on the study of systems, flows, and interactions. Mobility, flows, and the production of capital were physical processes involving place-based production of goods and services, and the physical movement of commodities and people through time and space. Accessibility was a product of location among origins and destinations of those commodities and people. Today our conceptualization continues to evolve in the face of wireless and wired technologies. We are at times both the producers and consumers of our own wares (Toffler, 1980), and increasingly engage in the use of information and communication technology (ICT) to perform obligatory and discretionary activities, and to consolidate and extend our social networks. In the face of the sort of spatial deconstruction offered by what Sheller and Urry (2006) and others have called, “the new mobility”, Transportation Geographers and those in many other disciplines face new challenges and research opportunities as they attempt to come to grips with the relationship between mobility, accessibility, space, and place in the information age. This session will explore recent theoretical, qualitative, empirical, and policy-based discourse and practice surrounding emerging geographical perspectives regarding relationships between technology, mobility, accessibility and daily life.
Wednesday
Urban Geography: Urban Processes and Models (from 8:00 AM – 9:40 AM)
Spatial Data Analysis, Visualization, and Modeling (from 1:00 PM – 2:40 PM)
Time Geography: Emerging Theoretical Developments, Implementations, and Applications (from 1:00 PM – 2:40 PM)
Originally designed to investigate various constraints of human activities in time and space, the time-geographic framework provides an integrated space-time environment to effectively and efficiently investigate the spatio-temporal characteristics of human activities and their interactions. There have been revived research interests in time geography in recent years. These research efforts include extending the time-geographic framework to accommodate the emerging hybrid environment of physical and virtual spaces, providing computational models and representations of the framework, developing GIS designs to implement the framework, and applying the framework to facilitate studies such as travel behaviors, activity patterns, accessibility assessment, urban structure, animal ecology, etc. This session will provide researchers a forum to share experiences and exchange ideas on recent theoretical developments, implementations, and applications of time geography.
Geographies of Play III: Embodied, emotional, sensory geographies of play (from 1:00 PM – 2:40 PM)
Christopher Harker (2005: 59) reminds us “Playing is not (just) kids stuff. Playing is something we all do, albeit to different extents and degrees, and this is something that needs a great deal more investigation”. These sessions respond to Harker’s appeal for more critical attention to be given to the study of the geographies of play. The sessions include papers from a wide range of disciplines and perspectives, to encompass child, adult and intergenerational experiences of play. The papers explore innovative ways of studying the geographies of play and embrace a wide range of diverse theoretical and methodological approaches.
Visualization (from 3:10 PM – 4:50 PM)
Urban Tourism (from 3:10 PM – 4:50 PM)
Thursday
Urbanism and Urban Planning (from 8:00 AM – 9:40 AM)
Agent Based Modeling, Simulation (from 8:00 AM – 9:40 AM)
Spatial Analysis and Modeling: Transport and Spatial Analysis (from 10:10 AM – 11:50 AM)
Cyberinfrastructure-Data and Knowledge Representation (from 10:10 AM – 11:50 AM)
The flourishing developments of shared geographic data, information, knowledge and computing resources have produced many products to facilitate the easy use of geographic resources. For example: 1) Google Earth and Microsoft Virtual Earth have changed how we explore geographic extent; 2) OGC developed multiple web services to facilitate communication among GIS components that are widely used in assembling services, such as spatial web portals; 3) Geographically distributed sensor webs have opened up the possibilities for real-time control of complex systems such as urban traffic; 4) Knowledge representation systems enable the enterprise to accumulate knowledge and make smart decisions. These evolutions adopt cyberinfrastructure to facilitate geographic research, development, and education.
Applied geostatistics (from 1:00 PM – 2:40 PM)
This session will provide an overview of the state-of-the-art in the application of geostatistics to a wide variety of disciplines.
Subversive cartographies (from 1:00 PM – 2:40 PM)
Subversive cartographies is a series of sessions jointly organised with the Maps in Society Commission of the International Cartographic Association. This first session brings together papers emphasizing the role of the aesthetic in the construction of alternative and artistic mappings. Common themes are the relations between artistic practice and mapping, narrative and (e)motional cartographies, and the politics of design.
Friday
Internet Mapping and Mash Ups (from 10:10 AM – 11:50 AM)
A Conversation with Noam Chomsky (from 2:30 PM – 4:10 PM)
Saturday
Visualization, Cartography, and Cognition (from 8:00 AM – 9:40 AM)
Build it, Mapt it, Web it (10:10 AM – 11:50 AM)
Visualization: Viewing Data in New Ways (from 10:10 AM – 11:50 AM)
Posted: April 12th, 2008 | 1 Comment »
So, ok the program for Monday’s Round Table on Real-Time Cities is now set. The informal aspect of the event should make it easy to rearrange it on the fly if necessary.
I will start of by introducing and defining the subject; Mentioning that, cities are by definition real-time, but the deployment of geo-information, mobile, wireless and sensor technologies allow to reveal the global, emerging aspects that can be reacted upon. In other words, a “real-time city” is a city in which system conditions can be monitored and reacted to instantaneously (Townsend, 2000); Making real the narrative of Archigram that suggested that the way the street feels may soon be defined by what cannot be seen with the naked eye “When it’s raining on Oxford Street, the buildings are no more important than the rain”. The visions behind “real-time cities” often refer to “pulsing cloud of data, instantaneous information, seamlessness integration, empowerment of the citizens, enhancement of our perception, reveal the city as we experience it, patterns of behavior, observe and improve“. For instance here and there I could find sentences such as: “Seamless integration of real-time information about events, resources, and personal experience within physical spaces” or “Strengthen our perception of the built environment as a place for social inclusion and collaboration” or “Before transport planning was about predict and accommodate and now it becomes more observe and improve“. This round table takes the opportunity to gather researchers in urban planning, geographic information systems, architecture, computer science, social sciences, and interaction design and share our perspectives on this new object of research. In 3 hours there will probably be no much more time than to break the ice and raise an awareness of the multiple issues inherent to the design, deployment and integration of real-time information systems in cities.
The session will be split in 2 main parts. At a first step, informal presentations and discussion around 3 topics:
Topic 1: New resources to describe cities (talks: Raj Singh, Paul Torrens)
Topic 2: The city as a platform for innovation (talks: Jonathan Raper, Georg Gartner)
Topic 3: Implications of the deployment of ubicomp technologies on the reconfiguration of cities (talks: Adam Greenfield, Carlo Ratti)
Then, in a second part, as long as time allows, discussion on three stakeholder perspectives
Citizens: What is a good real-time city?
Research: How can we define this research object? What drives us?
Practitioners: What are the expertise to design/manage a real-time city? What is the process (action vs. reaction)?
The round table will be directly followed by an MIT open lecture by Adam Greenfield entitled “The City Is Here For You To Use“.
Relation to my thesis: I guess at no other places than MIT, I would have been able to gather such a top set of people to discuss themes at the core of my thesis: digital traces, revealing the invisible, urban modeling and simulations, user-centered datasets and location-based services.
Posted: April 8th, 2008 | No Comments »
I set up a round table at the SENSEable City Lab on “Real-Time Cities” that will take place before Adam Greenfield’s talk next Monday (April 14th 2008, 2pm-5pm. Room 3-401). The pitch goes as follows:
The real-time city is now real! The increasing deployment of sensors and hand-held electronics in recent years is allowing a new approach to the study of the built environment. The way we describe and understand cities is being radically transformed – alongside the tools we use to design them and impact on their physical structure. The goal of this round table is to discuss and anticipate these changes from a critical point of view.
We will cover the theme of “Real-time cities” with specific discussions on (but not limited to): New resources to describe cities, the implication of the deployment of ubiquitous and sensors technologies on the reconfiguration of cities, the city as a platform for innovation, and what is a good real-time city?
I took the advantage the 2008 Association of American Geographers annual meeting to bring together some people who’s work I admire to discuss research works and visions linked to “urban computing” (“the integration of computing, sensing, and actuation technologies in everyday urban settings and lifestyles“). I am pretty confident in the line-up of main speakers:
+ Georg Gartner, Vienna University of Technology
+ Adam Greenfield, Nokia Design and NYU
+ Jonathan Raper, City University London
+ Carlo Ratti, MIT SENSEable City Lab
+ Raj Singh, MIT/Open Geospatial Consortium
+ Paul Torrens, Arizona State University
Unfortunately, I could not bring a female voice to this list. Hopefully it will come from the attendance.
Posted: April 7th, 2008 | No Comments »
As promised at last year’s Picnic, I have managed to have Adam Greenfield give an open lecture at MIT. There is no better moment to catch him before he completes his second book and he moves to Scandinavia for a long-term gig in the rubber business at Finnish Rubber Works. Adam kindly accepted to amtrak up to Boston and give an open lecture entitled “The City Is Here For You To Use“. It will take place on Monday, April 14, 5pm in Room 3-401.

In his presentation “The City Is Here For You To Use” Adam Greenfield takes everything explored in his book Everyware as a given, and a point of departure. He will assume that emergent technologies like RFID, mesh networking and shape-memory actuators will simply be part of how cities will be made from now on, and seeks to understand what impact they’re likely to have on metropolitan form and experience. Adam will make the case that these technologies can help us rediscover public space, and make suggestions how we might use them to reclaim that space as a common good and a resource for all. Anyone interested in understanding how the emergence of ubiquitous and ambient informatics will shape urban communities, physically and experientially, will find plenty to sink their teeth into.
Posted: April 4th, 2008 | No Comments »
Dan Catt‘s talk at the upcoming Where 2.0: Going Places on Flickr: The Significance of Geographical Information in Photos
Every photo has a location—it was taken somewhere. For photo-sharing communities like Flickr, geotagging enriches the database with location metadata and makes digital photos more useful and relevant to users, allowing them to not only easily search and organize their own photos but better browse images from around the world. With nearly 50 million geotagged photos on Flickr, around 32 million of which are public, Flickr senior engineer Dan Catt was able to use Flickr’s open API to create a new feature called Places. Places is a zoomed-in view of a particular location and allows Flickr members and visitors to explore that location through iconic photos.
and at Web 2.0 A Flickr Approach to Making Sense of the World
What do you do when you have well over 50 million geotagged objects? How do you actually do anything constructive with that? With emphasis on the How and constructive parts.
To start with we’ll take a quick(ish) look at the current state of reverse geo-coding; mapping latitude and longitude to an actual place. And what to do when that place is the wrong place or technically the right place but not what anyone calls it. Why it seems as though it should be simple but in reality it’s all terribly hard and we’re still just at the very start of that one. Geocoding != Maps.
Posted: April 2nd, 2008 | No Comments »
 In the swiss popular daily free newspaper Le Matin Bleu, squeezed between an article on youth violence and another acknowledging the emergence of bear communities in London…
Grâce à Internet, des scientifiques peuvent établir les circuits des touristes dans les villes
Les monuments les plus visités de Barcelone, de Rome ou de Florence? Les trajets pris pour les voir? Et à quelle heure? Tout cela n’a plus de secrets pour le Groupe de technologie de l’Université Pompeu Fabra, à Barcelone, qui a dressé un plan détaillé des chemins préférés des touristes. Comment? En analysant plus de 150 000 photos postées par environ 6000 personnes sur le site de Flickr. Des infos qui intéressent bien sûr déjà les institutions des villes et qui pourront suggérer d’autres trajets à ceux qui veulent éviter l’afflux de touristes!
Posted: April 1st, 2008 | No Comments »
 Some of the work on Tracing the Visitor’s Eye, Bicing and at SENSEable has been mentioned these past days in the Spanish media. In the free daily newspaper ADN Juan Freire describes in very accurate terms the Huellas digitales en las ciudades.
El objetivo inicial de este proyecto es evaluar el potencial de la información georreferenciada generada por usuarios para el análisis y la comprensión de los procesos urbanos, lo que permitirá en el futuro convertir las herramientas de visualización y las bases de datos púiblicos procedentes de la web 2.0 en excelentes instrumentos para los responsables de la gestión urbana (desde los planificadores a las empresas de transporte) y para los propios ciudadanos.[...] Un simple vistazo a los videos que resumen este proyecto muestran claramente los patrones de extrema agregación de los turistas y sus movimientos diarios entre los diferentes hitos turísticos de la ciudad. [...] Uno de los elementos más sofisticados de este proyecto es que tiene en cuenta la cobertura espacial de las imágenes, que estiman a partir del grado de zoom registrado como parte de los metadatos de las fotografías.
In Internet revela los movimientos de los turistas en las ciudades (catalan: Internet revela els moviments que fan els turistes a les ciutats), published in the catalan daily newspaper El Periódico de Catalunya, Michele Catanzaro focuses more on the potential implication on urban tourism.
Que el Camp Nou o la Sagrada Família están entre los monumentos más visitados de Barcelona no es ninguna novedad, pero los caminos que los turistas recorren para desplazarse entre las atracciones de la ciudad no son tan fáciles de prever. De hecho, oficinas y empresas de turismo gastan abultados presupuestos para predecir los caprichosos deseos de los viajeros. [...] Los mapas de Blat y Girardin pueden ayudar a programar mejor los horarios de apertura al público de los espacios ciudadanos, sugerir dónde es mejor colocar las oficinas turísticas e incluso qué áreas urbanas requieren manutención. Pero también pueden ser útiles para los propios turistas.
 To which, the daily Catalonia Today requests in “Barcelona tourists stick to well-beaten paths” that
The city needs to promote other worthy destinations, which would also relieve the congestion seen above.
Additonaly. El Periódico briefly reports in Visualizar el uso del Bicing (catalan: Visualitzar l’ús del Bicing) on the idea of implementing a stronger feeback loop in new urban systems supporting mobility, such as Barcelona’s Bicing.
“Si mapas de este tipo estuvieran a disposición de los ciudadanos, quizá se podrían autorregular en sus desplazamientos por la ciudad, optimizándolos en función de las condiciones”, comenta Girardin. Uno de los objetivos principales de la investigación, coinciden los dos investigadores de la UPF, es poner información compleja al alcance de los ciudadanos de la forma más clara posible.
Finally, the magazine on innovation “If… Revista de innovación” interviewed me on digital traces and Bicing: Conocer la ciudad siguiendo nuestras huellas digitales.
Un reportaje sobre las huellas digitales que dejamos inconscientemente en nuestro día a día por la ciudad, a través del Bicing en Barcelona. Un fenómeno estudiado por el ingeniero Fabien Girardin.