Footoscope: a deciphering tool for football amateurs
Posted: July 31st, 2012 | 2 Comments »
Sports have always kept a tight relationship with data to measure performances. It has been particularly the case to improve athletes capabilities with motion analysis or objectify team sports that are easily fragmented into single events (e.g. Sabermetics). With new means of producing statistics through video and sensor technologies, other sports have started the search for objective knowledge. In the domain of football (i.e. soccer) companies such as Prozone and Opta Sports have led the innovation in data collection. In parallel, some academics have been exploring this new terrain to apply their statistics-led methodology (see A network theory analysis of football strategies). Similarly, designers have also started to transform these new measures (often in real-time) into sophisticated visualization to augment the spectator’s experience (see In-screen sports graphics).
At Near Future Laboratory, we regularly investigate the implications of the emerging presence of data particularly in the domain of the city and its services. Our work requires the joint understanding of space (e.g. a territory, its rules, cultures, history), of the networks that compose the space (both physical infrastructures and digital activities) and the human behaviors manifasted in that space. As part of our self-started initiatives, we enjoy employing these prisms to explore other intriguing domains such as football. In this ‘pet project’, we collaborated with the prospective consultant Philippe Gargov of [pop-up] urbain, connoisseur and writer on the use of statistics in football (see Passer aux stats supérieures) to augment his knowledge of football and tactics with prototyped visualizations that revealed the layout of teams through the average position of players, the key players in the passing game and the orientation each player gives to the game. We called this experiment Footoscope.
Footoscope provides a perspective on the morphology and tactics of a football team according to raw data on its passing game (e.g. passes between players, positions of the players when receiving the ball, playing time) transformed into indicators (e.g. “betweenness”) and visualizations (e.g. flows in the passing game, orientation of the propagation of the ball, layout of the team). We prototyped it with Quadrigram in order to share the tools with amateurs who want to become ‘footoscopists’ and decipher data on team they know or want to explore. We tested to tool with Philippe Gargov based on the raw statistics of the World Cup in South African accessible on the FIFA web site. Philippe did a great job in mixing his knowledge on the competition with the use of Footoscope. The results (in French) discuss, for instance, the key role of Bastian Schweinsteiger in Germany’s midfield that other players such as Stankovic or An Yong Ha failed to reproduce; or the incapacity for Switzerland to manage the distances between its lines. Read more (in French) on the Footoscope web site.
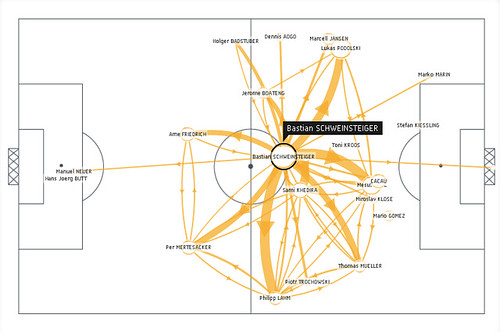
The key role of Bastian Schweinsteiger in Germany’s midfield, perfectly centered and well-connecter. More on Footoscope.
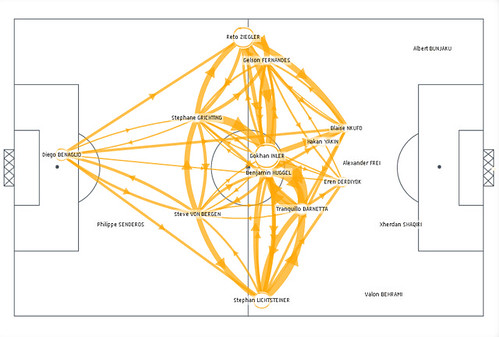
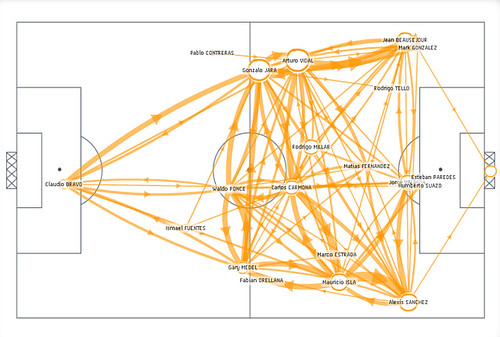
The incapacity for Switzerland to manage the distances between its lines, with its defense and strikers compacted at a short distance. This contrasts with a more balance team that takes a greater advantage of spaces such as Chile below. More on Footoscope.
Why do I blog this: Our pet projects are meant to explore new domains and ideas. Like other domains (e.g. cities, organizations) the analysis of football request the understanding of space, networks (data) and behaviors (observations). The collaboration with Philippe Gargov revealed some early insights on generating the dialogue between statistics and amateur knowledge of the terrain to produce a new apprehension of the game.
[...] ou une compétition. Pour les plus curieux, Fabien en a donné quelques précisions sur son blog (Footoscope: a deciphering tool for football amateurs) ; je ne saurais pas vous en dire beaucoup plus sur la partie technique, sinon qu’il [...]
[…] du logiciel « Quadrigram » développé par Fabien Girardin du Near Future Laboratory (http://www.girardin.org/fabien/seventh-and-half/2012/07/31/footoscope-a-deciphering-tool-for-footba… et permet de produire des cartographies des données (tout comme Gephi que nous utilisons par […]