Sketching with Data
Posted: November 11th, 2010 | Comments OffThese past weeks I had to chance to work with the alpha version of Impure, a new visual programming environment developed by my good friends at Bestiario. Impure offers a full visual language to retrieve, manipulate, process and visualize information:
Impure allows the acquisition of information from different sources, ranging from user-specific data to popular online feeds, such as from social media, real-time financial information, news or search queries. This data can then be combined in meaningful ways using built-in interactive visualizations for exploration and analysis.
Based on an event-based development structure, the software consists of 5 different modules.
1. Data Structures, which hold data coming from a data source (e.g., Number, String, List, etc.).
2. Operators, which have 1 or more receptors that enable the system to perform a specific operation (e.g., addition or subtraction).
3. Controls, which act as dynamic filters (e.g., interval selectors).
4. Visualizators, which receive data structures from operators or controls and visualize it. They usually return emitters on selected visual objects that can be used as input into another module.
5. APIs that allow real-time communication with various data sources such as Google, Twitter, Facebook, Flickr, Delicious, Ebay, etc.
The prime objective of Impure aims at bridging the gap between ‘non-programmers’ and data visualization by linking information to programmatic operators, controls and visualization methods through an easy visual and modular interface. Yet, I must admit that Impure has a lot to offer to programmers and data specialists; particularly those who necessitate to “sketch with data” as part of their practice. In other words, the type of professionals who process and visualize datasets as part of their investigation process rather than uniquely generating results.

My experience in leading investigations that aim in extracting value from network data, exploratory data visualization is crucial to quickly recognize patterns and understand complex events. But as my projects involve diverse sets of professionals (e.g. ) being able to quickly sketch an interactive dashboard is a guarantee to have a common language that helps the different actors in asking better questions, getting better feedback from them and properly focusing the investigation (some call it visual thinking or to some extend predictive analytics). Ultimately, the use of plateforms such as Impure offer that opportunity to collect insights that give a project the upper hand in decision making. Moreover, the flexibility of a visual programming environment permit to go beyond the limited possibilities for design of GIS and statistical softwares while reducing the fast-prototyping time necessary to program specific interactive visualizations (e.g. see the animations of traffic density and flows in Zaragoza, Spain, based on real-time information) produced in a few hours with Impure).
Practically, in addition to quickly share a first exploratory analysis, environments such as Impure can simplify the practice of ethno-mining particularly to co-create data with participants of the field research (see Numbers Have Qualities Too: Experiences with Ethno-Mining).
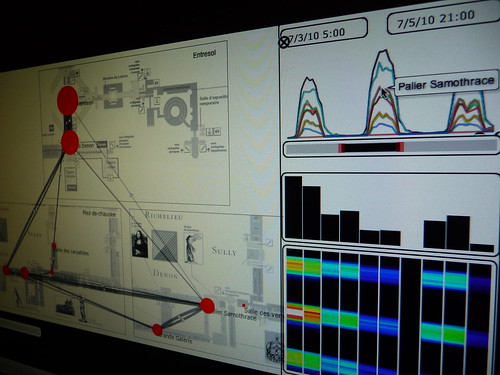
Sketching a solution for the Louvre Museum with Impure (see the complete “Sketching with data” Flickr set)
Similar approach to “sketching with data”, Stamen that has for long been leading investigative data visualization projects generally we divide their process into three distinct phases—explore, build and refine. Based on their experience, they outlined some of their common assumptions about data visualization and recommendations for how to do this kind of work; one particularly relevant to the exploration (i.e. sketching) phase:
(19) Start and End With Questions
“Traditional statistical charts can be a good first step to generate questions, especially for getting an idea about the scope of a data set. Good questions to start with include “how many things do we have”, “what do we know about each thing”, “how do the things change over time”, “how many of each category of thing do we have”, “how many things are unique” and “how many things is each thing connected to”. I don’t believe that any visualization can answer all of these questions. The best visualization will answer some questions and prompt many more.”
Apparently, they are engaged in the a similar path as Bestiario, using a Knight News Challenge grant to build a series of tools to map and visualize data that is truly Internet-native and useful. Flexible and “internet-native” environments that make easier to work with information are also emerging in the data storage end of “sketching”, for instance with the Barcelona-based FluidDB.
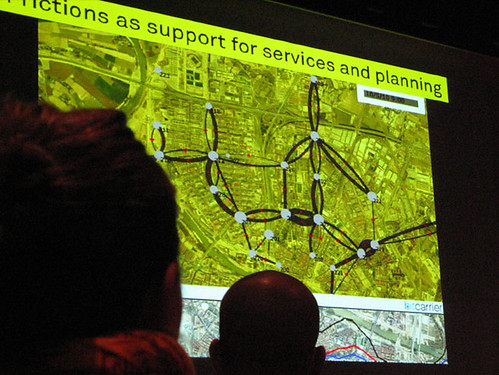
At Barcelona Design Week, sharing an animation of the traffic flows in Zaragoza sketched with Impure using real-time data feed from BitCarrier.