Fast Prototyping the Long Here with the Big Now
Posted: May 13th, 2010 | No Comments »There is an unwritten rule when fast prototyping that says that “one should know when to stop”. It is executed making up a deadline, fixing a scope and sticking to them. Last week’s Lift Conference marked the end of a fast prototyped pet project that contributed to this year’s theme “connected people” with an interactive map of Geneva from its social network activity.
The result highlights photogenic areas (e.g. lakefront, old town, parks) and events (Geneva Motor Show, Geneva Festival) based on the analysis of 3070 photos georeferenced by 1237 Flickr users over a full year. These persistent longitudinal measures (see Adam Greenfield’s description of the Long Here) are overlaid with the location of the most checked-in places in Foursquare within the week of the Lift Conference (see Adam Greenfield’s description of the Big Now). This (almost) immediate checkin-in trend acted as invitations to explore or rediscover Geneva.
This work is now archived (see Geneva From its Social Network Activities) and the milestones documented in Flickr.
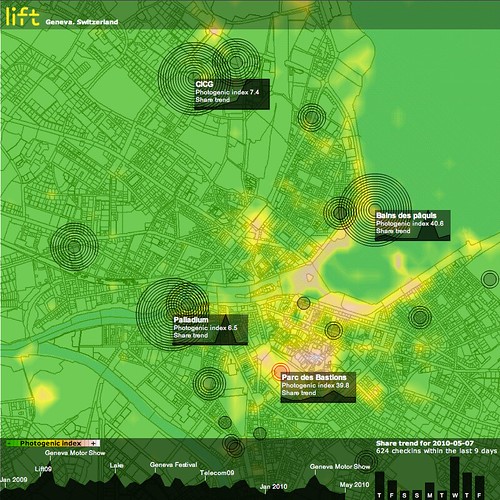
Through data analysis and visualization techniques, we produced an interactive map of the city, revealing photogenic areas (e.g. the lakefront) with public places (e.g. Bains des Pâquis, Parc des Bastion) and events (e.g. Geneva Motor Show, Geneva Festival, and of course Lift at CICG) people like to share online. Screenshot of Friday May 7, 2010, at the end of the Lift conference that took place at CICG in Geneva.
During the conference, I was asked a several times for the reasons and the technicalities behind the development of this prototype.
My approach to fast prototyping looks further than building preliminary models or patterns later applicable to full-scale developments. Instead, I integrate fast prototyping to my hybrid research process in which the exploration equals the value of the result. Indeed, prior to any result, the prototype helps support the reasons of the investigation and build arguments of its significance. More concretely, if I ever had to legitimize this work, here are a few details on the “why” and how” I have developed this visualization:
Prototyping to learn new skills and techniques
A first reason to prototype is to learn something, particularly in the development of new skills and techniques. In favorable fast prototyping conditions there is a dose of freedom that do not constraint to particular technologies. In this project, I explored what I believed where the best techniques to build each element of the data visualization. In details:
Data collection:
I integrated my pre-existing Java module to connect to the Flick API with the flickrj library. The Foursquare data were regulatory collected with a simple Python scripts that used the Python Library for the Foursquare API.
Data management and analysis:
A banal MySQL database fed data to R, a statistical software that no one never masters enough. In addition to my current set of scripts, I particularly toyed with the ggplot2 plotting system to work on the heatmap (see ggplot2: Quick Heatmap Plotting). I also thoroughly browsed the R Spatial Projects with to find attractive graphic solutions, but ended up using filled.contour because it was producing the most detailed results. As part of my idea to reveal Foursquare territories, I employed the tripack package to produce Voronoï “maps”. I abandoned this exploration after two iterations, as the maps and concepts were too hard to understand (see below)
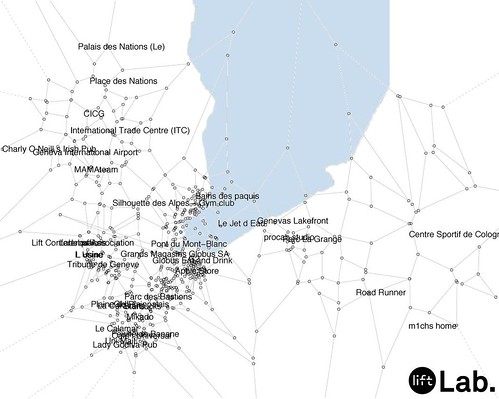
A tentative map of Foursquare “territories” in Geneva, using a Voronoï diagram produced with R (slightly skewed?) using the location of the most active places (more than 10 checkins not produced by the mayor).
Data interoperability:
The use of multiple technologies and programming languages forces the definition of XML Schemas to exchange data (when not using plain CSV files). Here I had to build my own schema as I am still looking for a proper schema for spatio-temporal data interoperability.
Data visualization:
This was the opportunity to get more familiar with the limits of the Flex graphics package, in comparison to what could have been done in Processing, particularly with the integration of a map. In this project, I was looking for an alternative to ModestMap (that I employ in other mapping projects) for a maximum freedom with different types of overlays. I toyed with the open source flex component HeatMap with time missing to produce a compelling solution. As a result, and for or simplicity reasons I ended up producing the Flickr heatmap with R.
Prototyping to surface problems
A part of the learning process is to understand the limits of a particular approach. As any user-generated content, the Foursquare dataset is particularly challenging because it contains inconsistencies that request manual data polishing, problematic when the solution must scale. The Foursquare API limit is another problem that can prevent from scaling-up from Geneva to another urban area with richer public activities. The workaround for this prototype was to solely analyze the 200 most active non-private “places”.
Prototyping to convey a message
A tangible and concrete example is a sure medium to communicate an investigation and its intentions. In this prototype, I want to first further emphasize the presence of spatial data from the use of social networks, that, when analyzed, can describe an city or a space. Second, these data have a temporal dimensions (historical for Flickr and immediate for Foursquare) as described by Adam Greenfield in The Long Here and the Big Now (see his talk at Lift). Third, beyond mapping data and the beauty of maps, I want to move the investigation to the development of quantifiable indicators that contribute to qualify a city, its spaces and its events (think of a form of Geodesign). The photogenic index that analyses the activity of photographers for an area and event is example in that direction. Finally, the imperfection of the results also highlight the limiting scope of the quantitative data analysis (see The “Quants”, their Normalizations and their Abstractions).
Prototyping to collect feedback
A prototype – even at an early stage – acts as an invitation to discuss opinions and criticize a concept. I apply an iterative process to fast prototyping that involves an increasing amount of pairs of eyes at each loop. The key is to make the object of development just good enough to understand and attract people, but never too polished in order to keep the options open. This iterative process with constant feedback helps each actor’s discourse to develop and helps frame further investigation. In this project, I received the first feedback on the graphic design of a spatio-temporal visualization that I serve for other projects.
Why do I blog this: I tried to provide answers the questions on the purpose of prototyping for Lift 10. Allocating time for fast prototyping is part of my research practice. It feed the development of other (more internal) projects that often involves more constraints and a limiting scope. I also recommend these rules to building prototypes written by Tristan Ferne.