Exploiting the Bluetooth Spectrum as Material for Space Management Strategies
Posted: March 17th, 2010 | No Comments »Over the years I have been investigating techniques and developing system that take advantage of soft infrastructures and their informational layers: triangulating WiFi signals as geolocation feature of a Pervasive Game (CatchBob!), processing GSM fingerprints to perform air-travel detection, analyzing georeferenced photos and aggregated cellular network traffic to develop attractiveness indicators or webscrapping activity data from bike-sharing infrastructure to simply visualize one dynamic of a city. These works encompass both the physical and the digital forms of the cityscape and their relationships with mobility and the use of space. Now at Lift Lab, I became further engaged with city governments, urban service providers and space managers who challenge me to transform my research into “operational” outcomes at best affecting their strategies at worst refining the understanding on mobility and occupancy levels.
These past months, I have been collaborating with BitCarrier, a company producing real-time traffic information. Their solution uses highly optimized Bluetooth scanners to estimate the speed of the traffic in urban areas as well as on highways. This information is crucial for the instantaneous management of incidents and traffic jams as well as for the improvement of traffic simulations algorithms necessary in urban planning and highway management.

In Wireless in the world as part of the Touch project, Timo Arnall makes visibible the objects sending and receiving radio signals.
Rationale
Our joint collaboration aims at exploiting their data as material for evidences on other dynamics of the city with indicators that can integrate and influence policies, strategies and design of multiple stakeholders (e.g. citizens, businesses, governments). Our work is tightly linked to the concepts of continuous post occupancy evaluation not limiting the evidences to the scrutiny of urbanism practices but rather opening them to multi-disciplinary colleges. The initial hypothesis is that, at an aggregated level, empirical evidences of car and pedestrian movements are exploitable material to improve the design and evaluation of space management strategies (e.g. wayfinding, usage of the space, hyper-congestion). This approach contrasts with current practices that are often based on the hunch and speculations with very little evidence, to the exception of a few projects (see for instance Intelligent Space and its path following survey).
Few methodologies have been using digital technologies to interrogate the dynamics of a space, and to investigate the presence or absence of people on the street. A central contribution is Space Syntax that is based on the spatial structure of the city and traditional surveys. The Cityware project aimed at “extending space syntax’s consideration of the architectural spaces created by the built environment to include the wireless interaction spaces created by Bluetooth devices“, However, to my knowledge, this academic work never translated into operational outcomes. As a consequence, unsurprisingly, leading solutions are being developed by hardware and software companies rather than academics and practitioners of the physical space. For instance Blip Systems a company that delivers information and services to mobile phone users, now also exploit their Bluetooth system to optimize passenger related processes and capacity in airports.
However, these exploitations of ubiquitous systems do not aim at developing urban indicators as material for strategy definition and evaluation, as I initiated with the NYC Waterfalls project at the MIT SENSEable City Lab.
The Bluetooth Spectrum
BitCarrier’s solution focuses on wireless interaction spaces of 5-30m of radius reserved to Bluetooth devices; an ideal range to capture movements on the street and other dense urban areas. Bluetooth-enabled mobile devices, when set to discoverable mode, emit a signal that enables them to interact with nearby devices. BitCarrier uses the scanning functionality of the Bluetooth protocol to detect the presence and speed of vehicles between specific areas of a city or a highway. Their optimized sensors scan at the frequency of multiple scans per second.
Fair use of aggregated, anonymized digital interactions
The detections of discoverable Bluetooth devices produces recordings that are pre-processed on each scanner with an asynchronous 128-bits encryption algorithm that prevent the storage of MAC address. The anonymized logs are then transmitted over a secured connection to a centralized server that aggregates the encrypted data over time, discarding any time period under a minimum amount of readings. Therefore it is necessary to generate enough collective interactions to give rise to a pattern of presence and movement reflecting the movements in the physical space itself. This combination of techniques to secure privacy is part of the discussions on the fair use of aggregated, anonymized behavioral data to both protect individuals right to privacy and extract value from data. The discussion of these techniques also responds to the necessity of applying transparent processes to make every stakeholder aware on the mechanisms to generate value from data. Other approaches, at a design level, include the use of signs to make obvious the purpose of the scanning of a wireless spectrum (see Dan Hill’s IxDA talk New Soft City). Making explicit the presence of wireless instruments is also part of public safety procedures with the necessity to guarantee and specify the use of wireless technologies that respect Specific Absorption Rate (SAR) level restrictions. For instance in the EU, according to International Electrotechnical Commission (IEC) standards, the SAR limit for mobile devices is 2 W/kg averaged over 10 g of tissue (see IEC 62209-1 ed1.0).
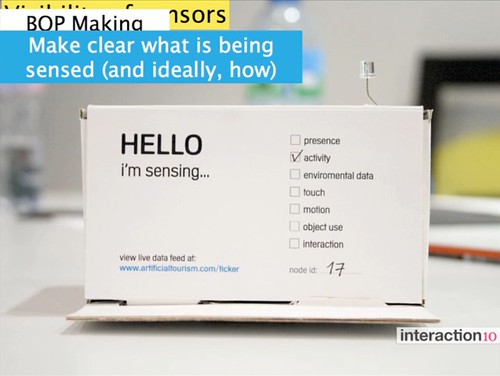
Courtesy of Dan Hill. Making clear what is being sensed. Extracted from Dan Hill’s IxDA talk on New Soft City.
Empirical observations
In a first case study in collaboration with the Mobility Service of the City of Barcelona, we first wanted to find out the correlation factor between the movements captured from the mobile device detections and the actual rhythm of the flow of pedestrians in the public space.
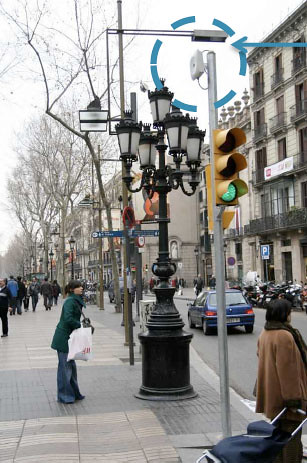
Bluetooth scanner deployed on traffic light at La Rambla
We retrieved a couple of months of records produced by 5 Bluetooth scanners, deployed by the Mobility Service of the city of Barcelona on light poles and traffic poles in the Barcelona city center in the Plaza Catalunya – Puerta del Angel – Rambla – Cathedral area. BitCarrier’s solution aggregated over 4 millions non-unique devices (about 1 million unique devices) into periods of 15 minutes, and we discarded the periods with less than 100 detected devices. The database provided a first understanding of the cyclical nature of passing Bluetooth traffic at the nodes and routes forming a connected graph of sensors.
The graph linking the observed areas is a fundamental concept of the analysis (similarities with Space Syntax “axial map” of the streets). This graph is analyzed according the weights and each node (i.e. aggregated substance of Bluetooth interactions) and route (e.g. average speed between two nodes), helping qualifying the space and its evolution over a period of time. Yet, the quality and representativeness of the data must be verified prior to any occupancy analysis.
Correlating Bluetooth interactions with actual physical activity
The Mobility Service of the City of Barcelona deployed one extra scanner in a metro station with turnstiles that aggregate by hours the number of entering passengers. Both metro and Bluetooth data suffer of noise generated by a) an amount of “wranglers” not paying their fare by jumping over turnstiles and b) the fluctuating range of the Bluetooth spectrum potentially interacting with devices of non-passengers. Nevertheless, with these imperfections taken into account it remains possible to determine the correlation factor between Bluetooth interactions and passengers movements. We applied the correlation for periods (hours) aggregating more than 200 detections of unique devices. The scattergram below correlating the device detection (horizontal axis) with the integration value of the metro station (vertical axis) reveals as large positive strength and direction of a linear relationship (+0.93). Note once again that no data or value on mobility is perfect. In this case, there is a certain bias in our approach because metro passengers represent a certain population that might be more in verse of carrying a Bluetooth-activated mobile phone than the general population. Similarly, other areas might reveal different correlation factors due to digital attractors. Nevertheless the large positive relationship we uncovered confirms that the actual physical activity conditions the activity on the Bluetooth spectrum.
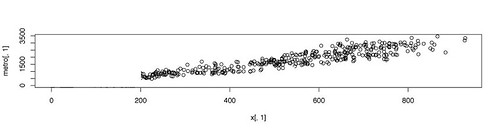
Correlation of device detections (horizontal axis) with the integration value of the metro station (vertical axis) reveals as large positive strength and direction of a linear relationship (+0.93).
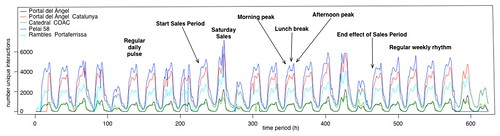
Measuring the ramification of an event
The empirical observations revealed the influence of the Winter Sales period over the general dynamic of the area we covered that hosts many shops. The Mobility Service of the City of Barcelona was particularly keen on obtaining indicators on the ramification of this phenomenon. Therefore, we compared the capture of absolute numbers of device detection of the average “eventless” period with the Winter Sale period, uncovering the areas that profited more of the Sales period than others. In a nutshell, the areas profiting the most from the increase of people are the Pelai area on Friday evening and Saturday afternoon, la Rambla on Saturday around noon and Puerta del Angel with the Cathedral area only on Saturday afternoon. The novelty of the approach is the ability to measure the impact of the event. For instance our analysis of Portal del Angel reveals an average absolute increase around 14% of activity on the Bluetooth spectrum over the Sales period. This type of observation over time can lead to the development of indicators of mobility, occupancy levels and usage of the space.
Defining indicators
At this stage, a pre-aggregation processing of the Bluetooth trails is necessary to further characterize the urban space. Therefore, we developed algorithms to extract pedestrian from vehicle movements and infer resident, transient, business, and tourist flows. These variables form time series that represent the temporal signature for each observed area and street (see for instance the application of eigenvector analysis on temporal signatures of a GSM network). When analyzed, these temporal signatures can help define indicators of the evolution of movements and presence of people. We developed a variety of indicators defining the streets of Barcelona based on:
- Walkability: considering the ratio of pedestrians and vehicles and a fluidity indicator. This observation is complementary to the walk score based on the topology and infrastructures Walk Score and Space Syntax’s Pedestrian Routemap that focus on spatial layout in shaping patterns of human behavior, with the support of traditional surveys.
- Accessibility: considering the main flows and speed to define level of access from any node (i.e. Bluetooth scanner) of connected graph (shallow and deep) from by the Bluetooth scanners.
- Permeability: level of protection of an area from the main areas, considering closeness and speed of flows. Inspired by “qualities” defined in Responsive Environment, A Manual for Designers.
- Attractiveness: as already explored in the New York City Waterfalls project with the application of comparative relative strength and centrality index of visitor traffic.
- Vitality: considering the constancy and high-level flows of both resident and transient activity. Inspired by Lynch in Good City Form and he definition of the five basic “performance dimension for the spatial form of cities”: vitality, sense, fit, access and control.
- Durability: constancy of the temporal signatures indicating the resistance to change or the maintenance of a current state.
Communicating, evaluating and planning with indicators
The first step of defining space management strategies is to gain an understanding of how people use and move through urban areas and then develop indicators to evaluate the strategies and their evolution. This practice necessitates a visual language through which interlocutors from different domains can communicate, evaluate, plan and make predictions about the resulting impacts.
Urban design and planning traditionally use visual ‘diagnostics’ for analyzing a situation and manipulate maps to communicate plans. Yet the representations generally map the – relatively durable – physical and functional layout of cities. In contrast, the activity patterns of crowds detected with wireless sensors are more dynamic. A visual language must prevent mismatches in trying to understand relations between the static and the dynamic. (see Jeroen van Schaick‘s paper Future Scenarios for the Relation between Advanced Tracking Research and Urban Design and Planning for a discussion on that topic). Nevertheless, the intuitive affiliation of practices dealing with the urban space to maps and diagnostic tools led us in prototyping dashboards to monitor and communicate the dynamic movements in the environment and their indicators.
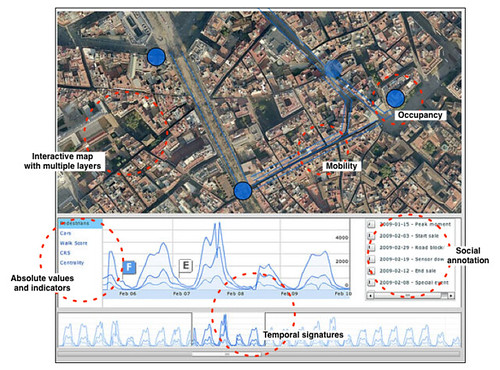
Fast-prototyped interactive dashboard for the Barcelona City Center, mixing areal and temporal views of absolute values and indicators, plus flags to annotate particular event.
Current applications
Good local indicators and knowledge on their rhythm can become operational material for multiple domains to determine and evaluate the appropriate strategies to space and mobility management. For instance, we have been perfecting a system to measure hyper-congestion situations and evaluate space management strategies. Our colleagues at BitCarrier collaborate with Centre for Innovation in Transport (CENIT) in Barcelona work on generating Origin-Destination matrices key to the modeling and prediction of traffic. Similarly, Arup and the Centre for Real-Time Information Networks (CRIN) at UTS have been investigating the Bluetooth wireless spectrum to detect transit activity in real-time, complementing current transit data that are not scalable and does not uncover individual ‘multi-modal’ trips (see Sensing the city, update one: our approach) Their project has priority of keeping the great promise of cities as enabler of both anonymity and community – current applications work with that balancing act, not against it.
Future: Bridging the applicability gap
We are imagining how a “data deluge” – with all manner of data continuously permeating the streetscape – can improve cities, their design and their policies. Yet, only a few researchers and practitioner have been really active on the field. Nevertheless appropriating Dan Hill’s words it seems clear that a shift to empirical observations and real-time data decision-making in the fields dedicated to the design, planning and management of space is fundamental, and not without complexities, but will surely happen. Our collaboration with BitCarrier certainly aims at shaping that future with clients/pioneers sharing the vision.
The challenges do not solely stand on technology and ethics. Our work is fundamentally multidisciplinary and the innovation based on the exploitation of empirical observations must still address mismatches between knowledge domains and practices. Particularly architecture and urban planning are not primarily about understanding a past or present situation. They specifically display possible and/or desirable futures of the layout of physical space (see Future Scenarios for the Relation between Advanced Tracking Research and Urban Design and Planning for a discussion on that topic). In contrast, the information our solutions provide display the actual pattern of movement either in the past or real-time. Our clients are helping us figure out how can current practices appropriate our alternative or additional method of observation and analysis. However, even in light of the accuracy and amounts of data, to many practitioners it is still not trivial to adopt new techniques and understand if theses information are really what they need. Bridging this applicability gap is a difficult task we like to accept!
Why do I blog this: Solidifying a rationale and grounding my discourse on current projects using Bluetooth. Now wearing the farmer’s hat. Planting seeds and weeding and hope for harvest.