Accepted Paper: Exploration and analysis of digital footprints through interactive visualization
Posted: January 12th, 2009 | No Comments »I will present the work and concepts developed with David Lu for the World’s Eyes visualizations at the GeoViz 3-days workshop on the “Contribution of Geovisualization to the concept of the Digital City“. The long abstract of “Exploration and analysis of digital footprints through interactive visualization” goes as follows:
In recent years, the large deployment of pervasive technologies in cities has led to a massive increase in the volume of records of where people have been and when they were there. With the ubiquity of mobile and wireless devices, the logs produced become anchored to the physical space with a geographical reference. The emergence of these digital footprints is expected to have significant impact on social sciences and urban studies with this novel access to a massive quantity of quantitative data. Indeed, pioneer works have demonstrated that their accumulation can uncover social behaviros and the spatio‐temporal interactions between people and places. In practice, the visualization and analysis of these urban data could deliver value added information in the different domains touching city management such as urbanism, environmentalism or tourism. For instance the visualization of the density of cellular network activity in a city can help traffic engineers improve public transport provisions in populated areas of a city at peak hours.
However, the dynamic nature of digital footprints and their fluctuating spatial and temporal resolution poses new challenges. Indeed these urban data come from cheap sources and infrastructures not deployed to sense the activities of a city. Therefore it is nececissary to assess the quality of the data through calibration with data collected with more traditional means (e.g. surveys, census data). These shortcoming greatly impair the use of these kind of information for city management and decision making in the near future. However, their visualization are already great tools to communicate with anectodes and evidences uncovered from exploration of this new types of data.
Our specific solution maps digital footprints visitors of a city leave behind them (Figure 1). The analysis of this traces allow to get a perspective on the density and flows of visitors and as a result compare the attractiveness of points of interests (Figure 2). Coordinated visualizations are integrated within individual probe interfaces, which depict the local data in user‐defined regions‐of‐interest. These probes empower users with the ability to observe, coordinate, and compare data over space and time and across multiple local regions. We have been developing this tool not only to interact with these digital footprings, but also to communicate explorations and findings. The visualization and the interaction also serve multiple different actors of the city such as the researchers, to interests groups, practitioners and politicians, to agree and disagree on how to interpret data and contribute contextual knowledge that deepens understanding.
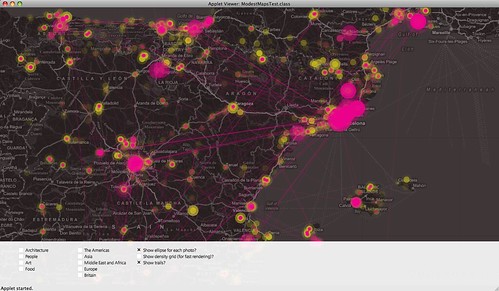
Figure 1. Interactive tool that visualize the density and movements of locals (yellow) and visitors (in pink) from the georeferenced photos taken in Spain and shared shared online.

Figure 2. Interactive tool that visualize the density and movements of photographers visiting Barcelona and sharing their photos online. Yellow glows shows the most attractive points of interest.