Representing Spatio-Temporal Traces
Posted: October 7th, 2007 | 1 Comment »So Nicolas opened a pandora box by mentioning in Chronotopic visualizations: representing traces of people in spatial environments that the collection and representation of traces left by people in space through technologies is gaining momentum in location-based computing. In the past, this type of research aimed at understanding mobility and travel behaviors or predicting them (e.g. John Krumm’s work on “Predestination”). However, the collection of mobility data is time consuming and requests non-negligible efforts in setting-up and deploying surveys infrastructures. The costs and privacy issues prevented such studies to move beyond the scope of transportation research (see Jean Wolf’s Applications of New Technologies in Travel Surveys for a survey). Now, the accessibility to affordable wireless sensors and the emergence of the geospatial web are generating new types of “digital footprints” left by people in space though technologies. My Tracing the Visitor’s Eye project is one example among many. For instance, Danyel Fisher developed Hotmap to visualize where in the world people look at when they use Windows Live Maps (see Imaging the City workshop and Fisher’s Hotmap looking at Geographic Attention.

Density of people “querying” Boston through Windows Live Maps. Courtesy of Danyel Fisher. Made with Hotmap
Now, as Nicolas questions, What types of affordances these new types of data/visualization create? First, they might be directed at professionals such as urban planners to build or refine their models, but also to any kind of industry that deploy services or infrastructures supporting mobility throughout a city. For instance, it might inform on the installation of Municipal Wi-Fi. A second line of investigation aims at feedback information back to the people in order to creating a control or feedback loop (i.e. a “mirror to ourselves”). This approach makes use of social navigation (”navigation towards a cluster of people or navigation because other people have looked at something“) to help individuals make more informed decisions about their environment. A few weeks ago in Rome, the MIT SENSEable City Lab closed the feedback loop as a first example of their Wikicity project. They aggregated various types data and visually mapped the density and movement of people, buses, taxis in real time throughout the whole of the Eternal City. “By revealing the pulse of the city, the project aimed to show how technology can provide the inhabitants with a better idea of their own city and can help adjust their behavior accordingly. In the context of the web, Mor Naaman translates the feedback loop into a “social media cycle” (see the slides of his presentation this week at Yahoo! Research Barcelona: How Flickr Helps us Make Sense of the World).

Crowds gathered outside Rome’s Museum of the High Middle Ages on September 8, 2007, to view a real-time display of population movement during the city’s Notte Bianca festival. (Courtesy of MIT’s SENSEable City Laboratory). In the media: ‘Wiki City Rome’ to draw a map like no other, City life on the screen, Wikis, the Semantic Web head to the streets, Les cartographes du téléphone mobile
Last week at Picnic, Adam Greenfield gave a presentation “The City is Here for You to Use: Urban Form and Experience in the Age of Ambient Informatics” in which he discussed how everyware is already affecting cities. More specifically, he mentioned this new types of real-time information about cities and their pattern of use, visualized in new ways and that information can be made available locally on demand in a way that people can act upon.
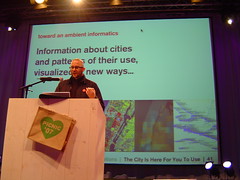
Adam Greenfield at Picnic07 on visualizing the patterns of use of the city: Stamen Design’s cabspotting, crime and real estate mapping, map of cities with WiFi hotspot.
Current scenarios for the application of these real-time visualizations mainly aim at facilitating a quick search or decision making such as determining a jogging path that corresponds to a combined query, or pedestrians that may eventually turn to interactive maps to avoid the masses or catch a bus. Other scenarios that take advantage of the temporal and social aspects of the traces could emerge. Such as providing an interactive tourist map of Switzerland based on Flickr traces revealing Zermatt, Interlakend and Davos and obscuring the non-relevant geographical location. But then, what are the scenarios beyond that?
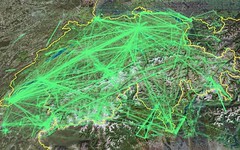
A map of Switzerland by tourists for tourists?
Scenarios based on digital footprints lefts by people in urban environments seem to rely on the structure (urban environment), the past/current usage (social, navigation, wayfinding) and the content (POI). An application should intersect these layers in a meaningful way. However, delivering a pure mirror of the reality might be hard to reach. In some cases a meaning emerges from incomplete data patched by data mining, filtering and visualization algorithms. Their choice impact the perception of the data, potentially bringing an objective angle of the content provider and modifying the behavior. This is when read/write urbanism flirts with captology (aka persuasive computing). In other words, do the traces or the algorithms used to treat them that influence the individuals/citizens? Moreover, as discussed this week with Infovis.net‘s Juan Dünsteler, information visualization struggles between educating people in reading visualization and providing relevant metaphores. Therefore, the data presented and misunderstood can impact the decision making (Visualizing Geospatial Information Uncertainty: What We Know and What We Need to Know).
Relation to my thesis: A follow-up to Inferring Spatio-Temporal Activities in Urban Spaces, seeking inspiration for an upcoming infovis.net article and in preparation of a position paper for the Urban Mixed Realities: Technologies, Theories and Frontiers workshop.
It seems indeed important to cross traces with usage : a vertical approach might reveal some patterns that would be otherwise disappear in the amount of data. Your catchbob data are meaningful in respect to the experiment, and would they be unlabelled and lost in the middle of the traces left by all the people walking around, their marginal informational value would be very limited.
Some subjective data would also be interesting : as Paul Dourish points out in Re-Space-ing Place notions of space and place are highly subjective and contingent on the people, their activities, etc… Similar traces might cover different perceptions of the journey.