Using R to Build Activity Visualizations
Posted: July 5th, 2007 | 3 Comments »News views using the statistical and graphical tool R for my Tracing the Visitor’s Eye project:
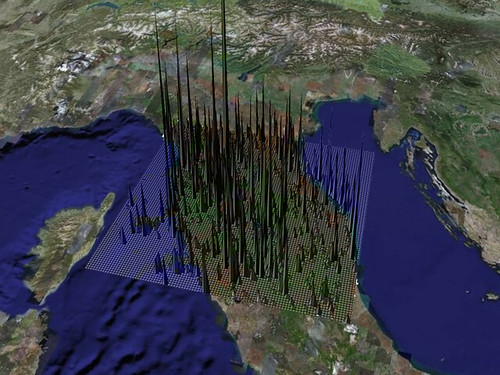
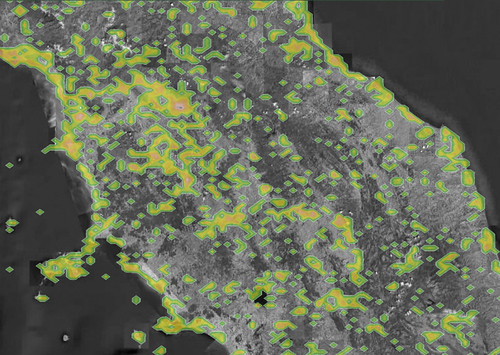
Relation to my thesis: I am developing a spatio-temporal data analysis tool to study how people use location (e.g. the information granularity) and location-aware applications (managing the uncertainty). I work with R to lose the dependance to GeoIQ and GeoCommons. They have been nice platform to quickly work on proof of concepts, but I know need a greater control on the algorithms I select. Next steps would be to replace Google Earth with an integration of Processing and the InfoScope
You might also check out WorldWind as a GE replacement.
I have been using WorldWind as well, but it still lacks of precise imagery for the regions I target.
[...] here with the Tuscany region with the 2006 dataset. tuscany3d2006.mov Relation to my thesis: In addition to R, I plan to use Processing to visualize the data of a couple of my current projects. The might be [...]