Inferring Spatio-Temporal Activities in Urban Spaces
Posted: March 26th, 2007 | 2 Comments »The main problem for urban planers, traffic engineers, transport authorities to perform urban modeling is the lack of real mobility data. While car traffic is pretty easy to estimate with sensors (cameras) deployed on the main city crossroads, when there is not “real” data, the only options are to perform in-sitiu surveys or rely on rough estimations (e.g. based on the police estimations). But the resulting picture is often inadequate, expensive—or both. Experiments to automatize the process remains very scarce. For instance, Eamonn O’Neill and Vassilis Kostakos (University of Bath, UK, as part of the Cityware project) presented at Ubicomp last year, a study on the deployment of a Bluetooth scanning system at every key points in Bath (with only 7.5% of the pedestrians carrying a Bluetooth enabled mobile phone). On the other hand, the transportation research has been (painfully) processing logs of vehicles location data generated by GPS embedded in cars. Finally, the market research industry has been trying to guess how many eyeballs pass a billboard by providing panelists with GPS units.
In the recent years, the large deployment of GSM phones generated a massive increase in the volume of spatio-temporal data that can be used to infer individuals or groups spatio-temporal behaviors. The MIT SENSEable City Lab (recently featured in the “E”‘s Technology Quarterly) has pioneered in the visualization of the movement dynamics of cellphone users and has rendered a real-time “pulse of a city” (video). The results take the form of luminous maps adorned with moving and colour-coded arrows, dots and patches of light that indicate the speed and population density of people in the city in question. Other example, IntelliOne developed TrafficAid that identifies congestion in real time by using cell phone location provided by GSM operators. The measurement system processes thousands of device locations per second, “snaps” each device to the road network, and monitors movement for a short period of time. Similarly, Timothy Sohn showed (also at ubicomp06) his mobility mode recognition experiment using everyday GSM traces. He used the logs generated by the everyday lives of three data collectors over a period of one month, yielding an overall average accuracy of 85%, and a daily step count number that reasonably approximates the numbers determined by several commercial pedometers.

MIT’s Real-time Rome: Crowd movement in Rome during the celebration of the World Cup victory.
I perceive 3 main domains of applicability of the processing and visualization of these massively collected personal logs, traces (i.e. history of previous locations)
- Provide urban planners, transport authorities and traffic engineers with data to refine their models of citizens spatio-temporal behaviors. For example, fine-grained “origin-destination” (OD) statistics allow to build more accurate traffic simulation.
- Bring new perspective for decision making and policies building. People-movement maps “will be invaluable” in planning housing and transport.
- Raise awareness and affect the discussion making of individuals or of a crowd. The above-mentioned TrafficAid system is one example. A step beyond, Intel Research Berkeley suggests the idea of Participatory Urbanism, AIR, or BioMapping . This feedback mechanism (urban awareness) is one fascinating aspect of such massive spatio-temporal data collection (this is probably what I would discuss if I get the chance to go to the upFing’07 Villes 2.0 workshop). In fact, Nicolas and I have been discussing quite a bit the use of asynchronous location awareness (traces) tools as a way to highlight social spaces inferred from the traces left in the environment .
Inferring spatio-temporal activities raise several issues that are at the core of my research. First, geographic information systems have limited ability to handle the temporal dimension. Then, the many sources of error and imprecision in the sensed data impact the quality and timeliness of the location data. The visualization might take into consideration the uncertainty in the delivered information (as raised by MacEachren et al in Visualizing Geospatial Information Uncertainty: What We Know and What We Need to Know). Finally, histories of location information mainly render a quantitative understanding of the city.

A visual log of physical presence
I have been with Radio-Frequency (i.e. WiFi and GSM) based positioning and mobility inference for the past 3+ years. Now, I explore a different approach to the collection and analysis of spatio-temporal activities. Based on a first experiment I called (inspired by Scott Smith) Tracing the Vistor’s Eye, I explore the potential of using user-generated geotagged content to infer activities. I have been relying on Flickr geotagged photo to define and confirm patterns of how tourists navigate the urban space (e.g. the elephant path along the Rambla, people do not walk to Gaudi’s Sagrada Familia). I believe that the richness of the collection and analysis of such data is that it carries a higher meaning that x;y;timesptamp location data. Taking, uploading, tagging and geotagging a picture can be interpreted as an act of communication rather than a pure implicit log of physical presence (Inspired by Nicolas’ work on automatic and manual location disclosure and The Error of our Ways: The experience of Self- Reported Position in a Location-Based Game. Therefore, my research agenda for this experiment is to:
- Build a framework that infers spatio-temporal activities in urban spaces based on user-generated content. Use tourists exploring cities as context
- Enrich quantitative spatio-temporal data with qualitative information embedded in images
- Integrate the notions of location information quality and timeliness in the data
- Analyze how Flickr users use the accuracy feature to geotag their images (where, what, when, history of use, overall usage over time). This is to provide a study on the quality of explicitly disclosed location information. In other words, what level of location information quality and timeliness must be delivered in order to be useful and relevant?
- Experiment with ways to visualize this type of spatio-temporal data with its uncertainty. Why not use the InfoScope. Here I aim to explore the parameters that influence successful uncertainty visualization.
- Evaluate the People-movement maps/visualizations. Maybe use the people of Barcelona Ecologia as expert users.
- (would be nice) Evaluate the completion of the “feedback control system”.
I have the core of the framework ready. It processed and generated KML files from test data of Barcelona, San Francisco, and Boston. I plan to collect data from the World’s Most Photographed Cities. As a next step, I will add the sense of origin and destination to visual representation of the traces. Moreover, I will infer the origin of the photographers as of being a tourist or a citizen. Finally, the photos will belong to several temporal categories (e.g. morning/afternoon/night, week day/weekend, special events) and location accuracy categories (e.g. street, neighborhood, city).
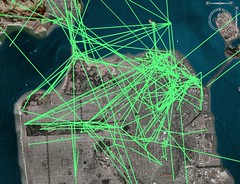
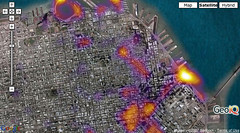
Early experiments with Flickr images taken in San Francisco between March 11 and March 25, 2007). The complete set of screenshots.
Relation to my thesis: I became acquainted of the multiple issues in collecting data collection during my discussions with the urban ecology agency “Barcelona Ecologia”, my readings in transportation research and the design and deployment of GSM-based personal mobility detection systems. This urban computing experiment is the first of the three experiment I plan to investigate my main research questions. It aims at providing clues to my sub-research questions 1) what level of location information quality and timeliness must be delivered in order to be useful and relevant? and 2) what parameters influence successful uncertainty visualization?
[...] Bei GeoIQ gibt es ja seit einer Weile nette Beispiele, mit denen sich gute eigene Karten (z.B. die Flickr-Heatmaps bei Fabio Girardin) darstellen lassen. Auch die GoogleMaps sind nicht zu verachten, wobei deren Fokus etwas mehr auf POIs und nicht unbedingt auf Flächen oder Strecken liegt. [...]
[...] is moving beyond the development of “telescopes and microscopes” to visualize these large large automatically collected data and improve the now limited significance of traditional surveys. The aim is to shift the urban [...]