Granularity Level Used to Geotag Images
Posted: December 13th, 2006 | 1 Comment »In extension to my previous Heat Map of Barcelona Geotagged Images, I extracted the granularity level used on 4100 geotagged images of Barcelona. Heat maps are on way to find patterns of usage of the granularity feature. I still need to separate manual with automatic geotagging by retrieving the GPS data contained in the EXIF tags.
In a “mining urban activity” perspective I planl to use images timestamps to start to generate the “traces” left by the visitor’s eye.
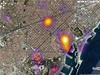
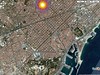
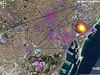
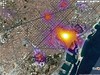
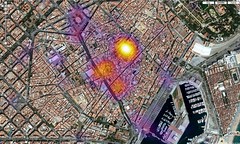
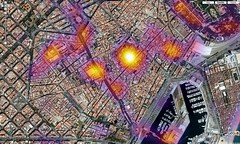
Levels of granularity used on 4100 images

City view with granularity levels of 8 (region/city level), 9, 10, 11, 12, 13, 14, 15 16 (street level)
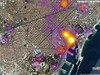
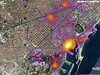

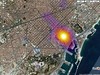
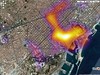
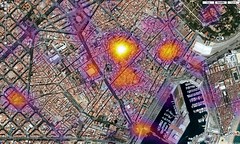
Old city level, with granularities 14, 15 and 16
[...] Since I last used GeoIQ to create my heatmaps on the usage of the accuracy feature in the Flickr geottaged images, Fortiusone has been busy developing an moving from Google Maps to KML as well as setting up a repository for shareable geospatial called GeoCommons. Besides uploading and downloading data from GeoCommons, users will be able to take their data and anyone else’s in GeoCommons and make a mashup with GeoIQ heat map generator. FortiusOne founder Sean Gorman provides a compelling proof of concept in the company’s blog with a mashup of highly rated bars and single women in Manhattan. [...]