Outcomes of the Visualizar Workshop Database City
Posted: November 28th, 2008 | 1 Comment »This year’s Visualizar workshop “Database City” ended a couple of weeks ago. Curator José Luis de Vicente designed this 2-weeks workshop in 4 steps. I started with a 2-days seminar to theoretically ground the theme, then 5 days to frame the goals of the 7 selected projects and perform some exploration with the tools and datasets. The seconds week was dedicated to the development of the visualizations and finally wrap everything into a self-contained web site and video. A blog (“diario de campo”) kept track of the daily outcomes of the process.
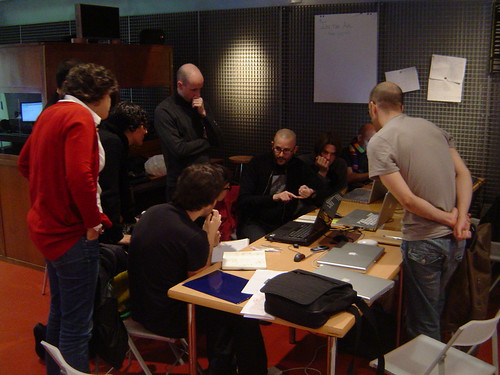
Lecturer Adam Greenfield on the battlefield (and why he was there)
As a lecturer and tutor of the first week, I helped participants in moving beyond the pioneers works that aimed at solely mapping the emerging patterns of these new urban data. I encouraged them to explore analysis techniques (e.g. data-mining, statistics, user interaction) as the necessary next step to understand and assess the real meaning and potentials of urban data for the digital cities.
Most of the groups delivered very high profile outcomes. They can be seen at Medialab-Prado in Madrid until January 11. Great works include:
In the Air, led by Nerea Calvillo
In the Air is a visualization project which aims to make visible the microscopic and invisible agents of Madrid´s air (gases, particles, pollen, diseases, etc), to see how they perform, react and interact with the rest of the city.

The visualization tool is a web-based dynamic model which builds up the space the components generate, where through data crossing behavior patterns emerge. The results of these data feed a physical prototype of what we have called a “diffuse façade”, a massive indicator of the air´s components through a changing cloud, blurring architecture with the atmosphere it has invaded and mediating the activity of the participants it envelops. (Wiki of the project – Video of the making)
Murmur Madrid, led by the group Writing Academic English
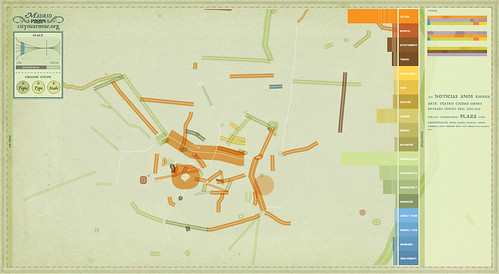
Visualising the media attention to the urban space, street by streets. Official news, blog and personal website, thematic media will be monitored to generated maps that highlight the pattern of perceptions on the urban space. This mapping will lead to the creation of an atlas that will monitor in time the changing perception of the city areas. The atlas will produce different dynamic visualizations based on themes, sources and time. (their stunning poster on How does a Murmur come to life?)
Much Ado About Nothing, led by Iván Huelves Illas

This project proposes to create an interactive tool (mixing visualization and auralization) that makes it possible to consult noise level at specific locations in Madrd.
BCNoids, led by Marina Rocarols and Enrique Soriano

A group of students in architecture that used a Boids framework to develop an interactive visualization of the online data generated by the bike-sharing system Bicing (Video of their experiments). The long term objective is to design an applet for the improvement of the bicing website, including a prediction of the number of available bikes in each station.
Relation to my thesis: A unique hands-on workshop where I probably learned as much as the participants. There is still a high fascination in mapping urban data and our digital footprints. To try to move beyond the pure innovative visualization, I challenged very early the groups in asking themselves “so what?”, in other works: “why should people care?”, “who do I communicate this to and for what purpose?”, “what are the scenarios of interactions?”, “what is their context?” and question how these kinds of works and the message they carry integrate the digital city of the future (e.g. cultural, readability issues).
Many thanks for José Luis de Vicente for the invitation. It was great fun to cross path with the Bestiario‘s Ortiz cousing Andrès and Santiago, Juan Freire (in his talk… he puts his marin biologist hat and draws comparisons between the ocean and the city and their digital skins… with references to Stephen Graham, now my chapeau is off), Greg J. Smith, Futurelab’s Dietmar Offenhuber and good companion Adam Greenfield and and the energetic media lab prado squad,
Apparently, Dan Hill is running a similar 2-weeks sting at the antipode: The street as platform, under construction.


