Portalvisualizer
A joint project by Patrick Jermann and Fabien Girardin at the CRAFT for the TECFA Seed informative art contest.
Some Technical Explanations
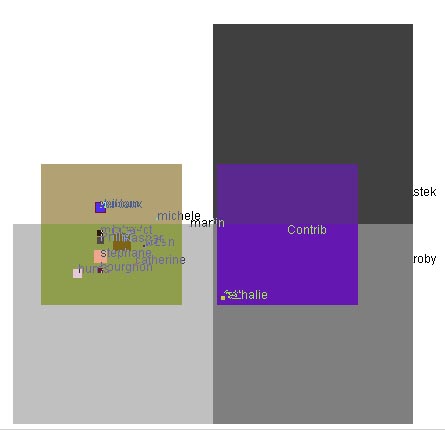
The data for visualisation are based on a table of contingency. The table's rows correspond to the users of the portal. The table's columns correspond to some indicator's frequencies. We tried out 2 set of indicators. The first set of indicators corresponds to the tools available in the portal, e.g. Threaded Discussion, Private Messages, News, etc. The second set consists of 2 variables called Interact and Contribute. They reflect how many times users are responding to others' contributions (Interact) versus posting new content on the portal (Contribute).
We then used correspondance analysis on that contingency table to produce a 2 dimensional graph that allows the simultaneous representation of people and indicators. The closer two points are together, the more similar their profile. So, if two people are close together, they have participated to the portal's life in a similar way. If a person is closer to an indicator (e.g. Interact) than another (e.g. Contribute), it means that this person has interacted more than contributed. Also, if two indicators are close together, they were used by the same people with a similar frequency. Finally, the distance of a point to the origin of the graph, indicates its typicality, wether its profile is special compared to the overall participation in the portal.
R software was used to compute the analysis.
System Requirements
View SVG with the SVG plugin from Adobe.
Install the DivX 5.1.1 codecs to view the AVI files.
Applets run on a not too old web browser with a not too old virtual machine.
Tool Indicator

[SVG]
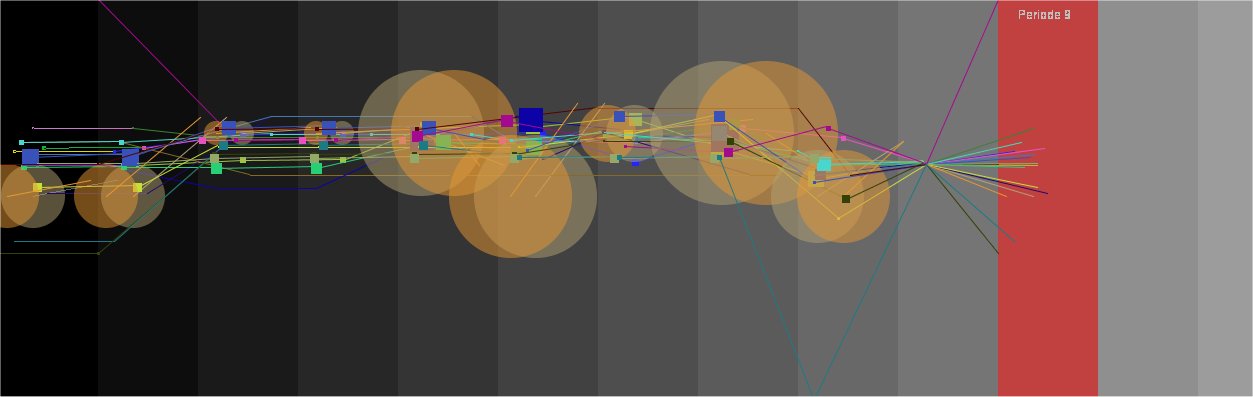
Activity Indicator

[SVG]
Activity Indicator II
[Applet] [AVI] (1.5MB - divx5.1.1)
Portal History
[Applet] [AVI] (419KB - divx5.1.1)
Fun
contribution by Nicolas Nova